How to Read the Integrating Sphere Test Report: A Comprehensive Guide
When we evaluate the quality and efficiency of lighting products, the integrating sphere test report provides key analysis. This test report analyzes the performance of lighting products in detail, helping manufacturers and consumers make informed test analysis.
However, when you get this report, how do you know whether it is good or bad? So you still need to understand this data and be familiar with various technical terms and indicators.
In this guide, we will explore the key components of the integrating sphere test report, walk you through how to interpret it, and provide tips for using this data to effectively compare products.
What is an Integrating Sphere Test?
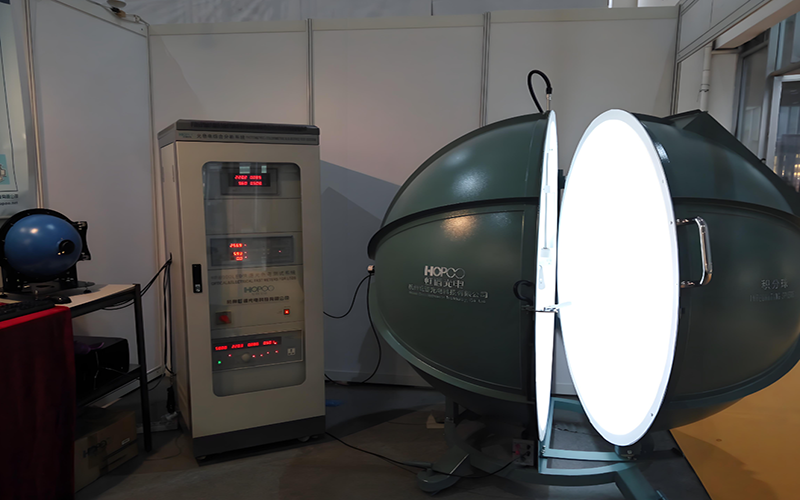
Integrating sphere testing is a widely used method for measuring the optical properties of light sources such as LEDs. An integrating sphere is a hollow spherical device with a highly reflective material coated on the inner surface.
When a light source is placed inside the sphere or near an opening, the light is reflected multiple times within the sphere, creating a uniform, diffuse light field.
This setup allows for accurate measurement of a variety of lighting metrics, including luminous flux, color temperature, power, and color rendering index (CRI). The resulting data provides a comprehensive overview of the light source’s performance.
Why Integrating Sphere Tests Matter for Lighting Products?
Integrating sphere testing is vital in the lighting industry. Integrating sphere testing exists to help ensure that products meet quality and safety standards. For example, our products LED strip lights, will also pass integrating sphere testing. Accurate testing allows manufacturers to provide reliable specifications such as brightness, color consistency, and efficiency.

For consumers, these tests ensure that the products they get meet their needs and expectations. Integrating sphere data can also ensure consistency between different production batches, helping to maintain consistent product quality over time.
Key Components of an Integrating Sphere Test Report
An integrating sphere test report includes multiple parameters that indicate a lighting product’s performance. Each metric provides valuable information about different aspects of the light source’s quality. Key components typically found in these reports are:
- Spectral Power Distribution (SPD)
- Luminous Flux
- Luminous Intensity
- Color Rendering Index (CRI)
- Correlated Color Temperature (CCT)
- Total Luminous Flux
- Luminous Efficacy
These integrating sphere test report elements are crucial for assessing a lighting product’s efficiency, color quality, and brightness.
Interpreting an Integrating Sphere Test Report: A Step-by-Step Guide
Next, we will explain each of the main parameters in the integrating sphere test report in detail and provide guidance on how to interpret these parameters.
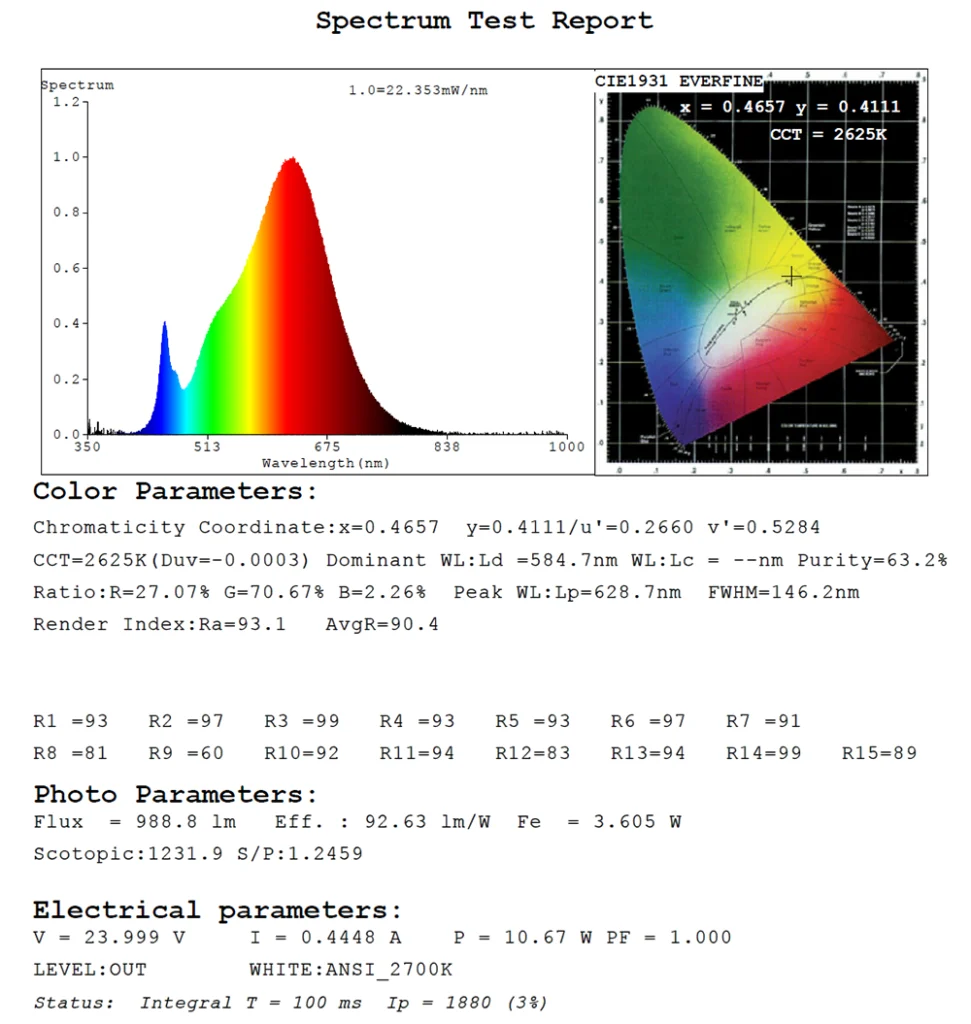
Spectral Power Distribution (SPD)
- What is SPD?
Spectral Power Distribution (SPD) represents the power output of a light source at each wavelength across the visible spectrum. It reveals the balance of colors in the light and helps assess color quality. - How to interpret the SPD curve:
An SPD curve shows the intensity of light at each wavelength, typically between 380 and 780 nanometers. A well-balanced SPD curve with a smooth distribution across colors indicates good color rendering ability. Peaks in certain areas (e.g., blue or red) may affect color perception.
Luminous Flux
- Definition and units:
Luminous flux, measured in lumens (lm), is the total visible light emitted by a source. This value is crucial for understanding the brightness of a light. - How to calculate luminous efficacy:
Luminous efficacy is the ratio of luminous flux to power consumption, measured in lumens per watt (lm/W). Higher luminous efficacy indicates a more energy-efficient light source.
Luminous Intensity
- Definition and units:
Luminous intensity, measured in candela (cd), describes the concentration of light emitted in a specific direction. It’s an important metric for focused lighting applications, such as spotlights. - Understanding the candela unit:
Candela measures the amount of light emitted per unit solid angle. For applications requiring directional lighting, a high candela value indicates a more focused light output.
Color Rendering Index (CRI)
- What is CRI?
CRI, measured on a scale of 0 to 100, indicates how accurately a light source reveals colors compared to natural sunlight. A higher CRI means better color rendering. More CRI information, pls read What is the CRI (Color Rendering Index)? 2024 Ultimate Guide - How to interpret CRI values:
In LED lighting products, most customers choose CRI80 and above, which is sufficient. Values above 90 are excellent. Higher CRI lights are ideal for applications where color accuracy is critical, such as photography or art studios. When you choose the CRI, pls read Why CRI is Important? 80 CRI vs. 90 CRI vs. 95 CRI
- Definition and units:
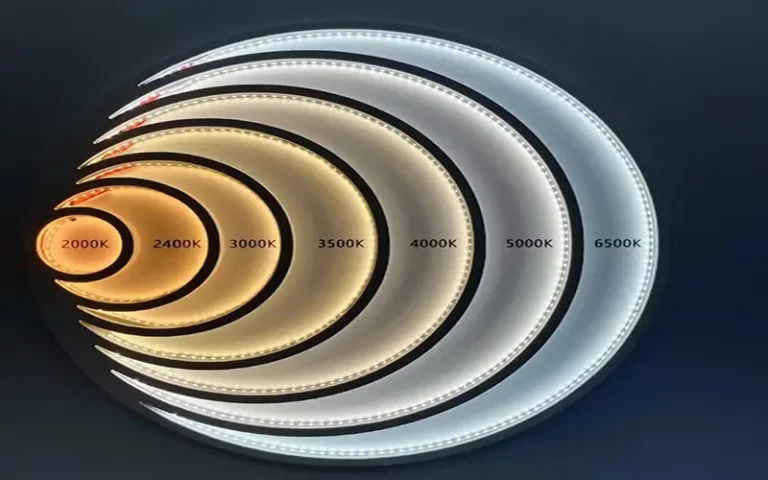
CCT describes the color appearance of light in Kelvin (K). Lower CCT values (2700-3000K) produce warm, yellow light, while higher CCT values (5000-6500K) produce cooler, blue light. Of course, there are also neutral color temperatures, such as 4000K. More cct details, pls read What is Color Temperature of LED Light Strips? - The relationship between CCT and color appearance:
CCT affects ambience; warm light is relaxing and soothing, while cool light is invigorating. Choosing the right CCT can enhance the function and feel of a space.
Total Luminous Flux
- How to calculate total luminous flux:
Total luminous flux measures the entire output of visible light from a source. It’s often calculated by multiplying luminous efficacy by power consumption. High total luminous flux is essential for spaces needing bright, even illumination.
Luminous Efficacy
- Definition and units:
Luminous efficacy (lm/W) is a measure of how effectively a light source converts power into visible light. It’s a key indicator of energy efficiency. - Factors affecting luminous efficacy:
Factors like light source type, power input, and design can impact efficacy. LEDs often have high luminous efficacy compared to traditional lighting, making them more cost-effective.
How to Use Integrating Sphere Data for Product Comparison?
When comparing lighting products, integrating sphere data can help you evaluate which product will best meet your needs. For example, if energy efficiency is a priority, focus on luminous efficacy.
If accurate color representation is critical, look for high CRI values. For general brightness, compare total luminous flux and luminous intensity. Analyzing these data points allows for an objective comparison of different lighting options.
Analyzing the Data: Key Insights
The data in an integrating sphere test report reveal several key insights about a lighting product’s performance. High luminous flux and efficacy values indicate brightness and energy savings, while high CRI values ensure accurate color representation.
Additionally, understanding the SPD curve helps you anticipate how a light source will affect the ambiance and color perception in a space.
Common Analysis Issues
There are some common misconceptions when interpreting integrating sphere data.
- High luminous flux does not always mean good lighting quality
- CRI and CCT are also critical for a comprehensive evaluation.
- High CCT values may be attractive for brightness, but may be too demanding for residential spaces.
- Understanding what each parameter really represents can help avoid misconceptions and ensure you choose the best lighting product for your application.
Conclusion
Understanding an integrating sphere test report is essential for evaluating and selecting lighting products effectively. From luminous flux and luminous efficacy to color temperature and CRI, each metric offers insight into a product’s performance, efficiency, and suitability for specific applications.
ESSENLED, as a professional manufacturer of LED strip, takes pride in offering high-quality products backed by reliable performance data. Our commitment to excellence is reflected in our integrating sphere testing, ensuring that our lighting products meet rigorous standards for efficiency and quality.

